R. M. Thomson and R. E. P. Taylor and D. W. O. Rogers
Introduction:
Welcome to the Carleton Laboratory for Radiotherapy Physics (CLRP) eye plaque dosimetry website. Here you will find three dimensional dose distributions in the eye region for the plaques of the Collaborative Ocular Melanoma Study (COMS). These dose distributions were calculated using BrachyDose,1 a fast EGSnrc user code for brachytherapy applications. Scoring dose in water in an array of (0.5 mm)3 voxels spanning the eye region (see figure 1), BrachyDose can achieve 2% statistical uncertainty on the dose to the tumour apex (for a 5 mm high tumour) in three minutes on a single 3.0 GHz Woodcrest core. The time is reduced to about thirty seconds for an array of (1 mm)3 voxels spanning the same region.
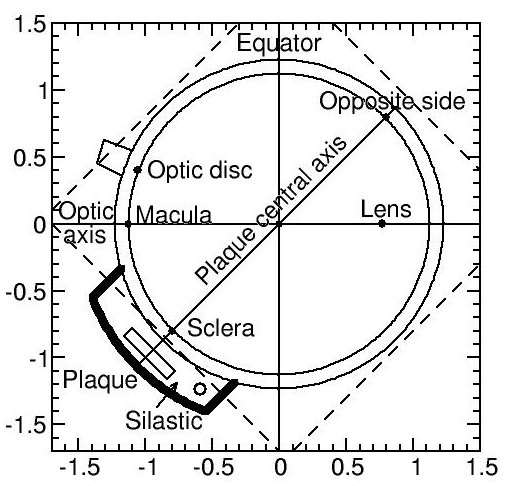 |
Figure 1An example configuration for eye plaque brachytherapy showing a 12 mm COMS plaque. The eye is idealised as a sphere of radius 1.23 cm. The dashed line shows the voxel grid in which dose is scored. Several points of interest for eye plaque dosimetry are indicated. |
For more information, please refer to our article published in Medical Physics, available here. We ask anyone using the data found on this web page to cite this article.2
The information contained in this CLRP eye plaque database is provided for research and educational purposes only and must not be directly used for clinical applications.
Dose distributions:
The dose distributions for COMS standard eye plaques with diameters ranging from 10 to 22 mm, in 2 mm increments, appear here. The plaque backings are constructed of Modulay (a gold alloy) and the insert is made of Silastic (a silicone polymer). The plaques carry either 103Pd (Theragenics model 200) or 125I (GE Healthcare/Oncura model 6711) seeds.3,4 The seed centre coordinates were provided by TG-129 of the AAPM in 2007 (private communication, S. Chiu-Tsao, 2007) and are available here. Each dose distribution results from the simulation of 1010 particle histories. The plaques are simulated at the centre of (30 cm)3 of water (density 0.998 g/cm3).
The origin of the plaque coordinate system is taken to be 1 mm away from the inner surface of the Silastic insert at the centre of the plaque, coinciding with the inner sclera. The plaque's central axis defines the z-axis and the x and y directions are transverse to the plaque. Dose is scored in an array of (0.5 mm)3 voxels, with the first voxel centred on z=-0.05 cm, and extending out to z =2.45 cm. In the x and y-directions the grid extends from -1.25 cm to 1.25 cm. The dose is set to zero in any voxel intersecting the plaque.
Dose is reported in terms of the dose rate per unit seed air kerma (units: Gy U-1h-1 where 1 U=1 cGy cm2 h-1). To obtain the total dose (in Gy) for a treatment, the data must be multiplied by the air kerma per seed (in units of U), and integrated over the treatment time, taking into account the exponential decay of the sources. Statistical uncertainties (1 sigma) on the dose in each voxel are included in the files as fractions of the local dose.
3ddose files encode a 3 dimensional dose distribution in a simple text format based on the description given in the EGSnrc statdose manual. The files contain six different sections:
- Number of voxels in the x , y and z direction
- Voxel boundaries of the x axis given as real numbers in cm
- Voxel boundaries of the y axis given as real numbers in cm
- Voxel boundaries of the z axis given as real numbers in cm
- Dose values of each voxel as real numbers, starting at the lowest (x,y,z) coordinate and increasing in x, then y, then z
- Fractional uncertainty of each voxel as real numbers, starting at the lowest (x,y,z) coordinate and increasing in x, then y, then z
The values within each section are delimited with space characters. The sections themselves are delimited with newline characters. CLRP in-house software to analyze 3ddose files is available here.
|
125I Plaques: |
103Pd Plaques: |
| Right-click links and Save-As to download | |
Examples:
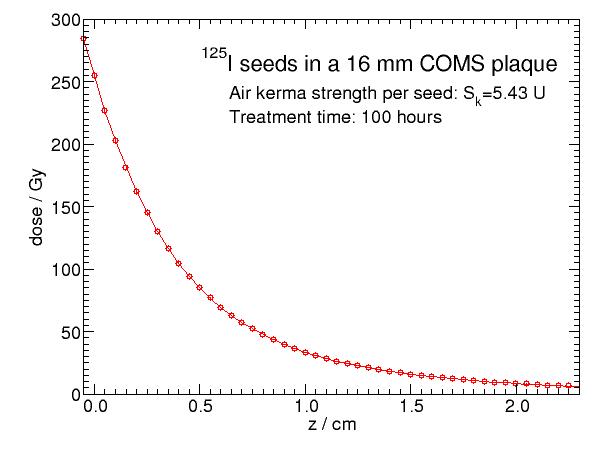
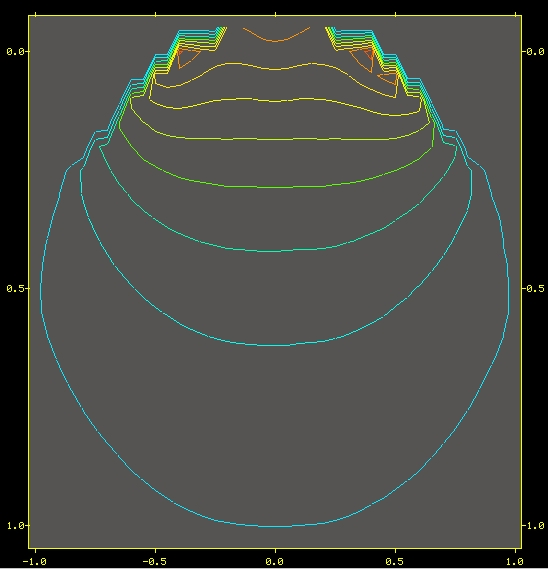
The following figures are plots produced using the three-dimensional dose distributions for the 16 mm COMS plaque filled with 125I seeds. In this example, the seeds each have an air kerma of 5.43 U and the treatment time is 100 hours. Figures 1 and 2 were produced using statdose while figure 3 is from dosxyz_show. The ridges in the upper part of figure 3 are due to the fact that the dose has been set to zero in voxels intersecting the plaque.
Figure 2 |
Figure 3 |
 |
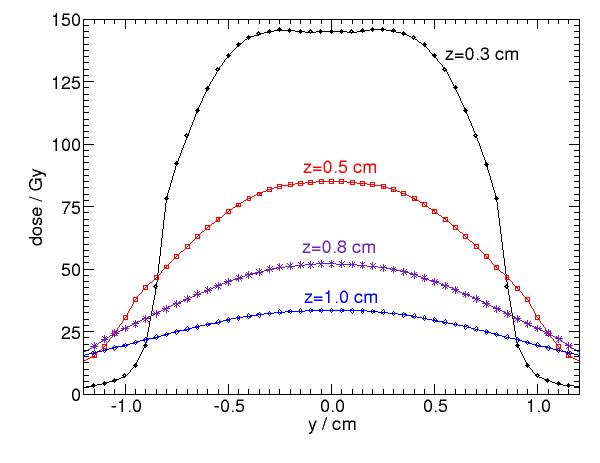 |
| Dose versus depth along the plaque's central axis. | Dose versus position transverse to the plaque, y, at x=0 and for various depths z. |
Figure 4 |
|
 |
|
| Isodose contours in the xz plane. The spatial scale is in cm. |
Contact Information:
rthomson
 physics [dot] carleton [dot] ca (Rowan Thomson )
Phone: 613 520-2600 x7540
drogers
physics [dot] carleton [dot] ca (Dave Rogers )Phone: 613 520-2600 x4374
Physics Department
Carleton University
1125 Colonel By Drive,
Ottawa, Ontario, Canada
K1S 5B6
References:
1. R. E. P. Taylor, G. Yegin, and D. W. O. Rogers, Benchmarking BrachyDose: voxel-based EGSnrc Monte Carlo calculations of TG-43 dosimetry parameters, Med. Phys. 34, 445-457 (2007).
2. R. M. Thomson, R. E. P. Taylor, and D. W. O. Rogers, Monte Carlo dosimetry for 125I and 103Pd eye plaque brachytherapy, Med. Phys. 35, 5530-5543 (2008).
3. R. E. P. Taylor and D. W. O. Rogers, An EGSnrc Monte Carlo calculated TG-43 parameter database, Med. Phys., 35, 4228-4241 (2008).
4. R. E. P. Taylor and D. W. O. Rogers, The Carleton Laboratory for Radiotherapy Physics TG-43 Parameter Database,