Studies in Position Sensing from Charge Dispersion
1.0 Introduction
2.0 Theoretical Model
3.0 Experimental Setup
4.0 Analysis
5.0 Concluding Remarks
1.0 Introduction
The spatial resolution of a TPC in a high magnetic field is dominated by the ExB and track angle systematic effects. Replacement of the usual anode wire/ cathode pad readout with one based on micro-detectors with anode pad readout would almost entirely eliminate the systematics and has the potential to improve TPC preformance significantly. However, the supression of transverse diffusion in a high magnetic field may result in the collection of most of the charge within the width of a single anode pad, resulting in a loss of resolution. For better resolution, one will need either a finely segmented anode pad structure wuth a prohibitively large number of channels of electronics or the complication of some specially shaped pads which enhance anode charge sharing.
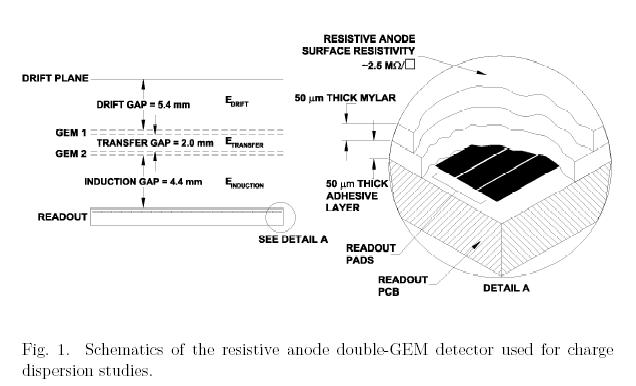
With certain modifications to the anode readout structure, it is possible
to measure the position of a localized charge cluster in a micro-detector with
pads that are wider than have been used so far. A thin high surface resistivity
film is glued to a separate readout pad plane and is used for the anode (fig.
1). The resistive anode form a 2-dimensional RC network with respect to the
readout pad plane. Any localized charge arriving at the anode structure will
be dispersed. With the initial charge dispersed and covering a larger area
with time, wider pads can be used for the signal pickup and position determination.
Below is a summary of the studies.
Back to Top
2.0 Theoretical Model
The resistive anode and readout plane can be modeled as a 2 dimensional RC network using the well-known Telegraph equation. Fig 2 shows the solution of the system for a point charge occuring at the origin at t=0. Note that as time increases, the charge spreads.
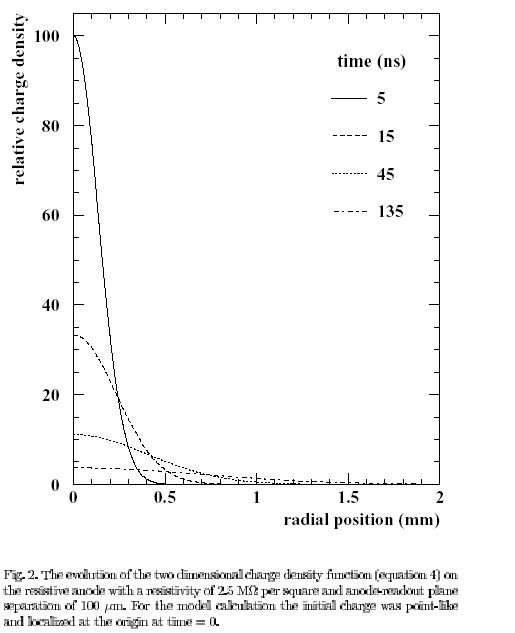
The charge dispersion measurements were carried out using long strips. Since a spatial co-ordinate measureent for long-strips is only meaningful in a direction transverse to the strip length, we can solve the 1-dimensional telegraph equation using appropriate boundary conditions (grounded at the sides), and initial conditions (shape a location of inital charge cloud). The charge density function can be solved as a function of time and space (1 dimension in this case).
The signal on a readout strip can be computed by integrating the charge density function over the strip width. Furthermore, the finite extent of the initial charge cluster, the intrinsic detector rise time as well as the rise and fall time characteristics of the front-end electtronics determine the shape of the measured pulse. All these parameters need to be included in the model to compare to experiment.
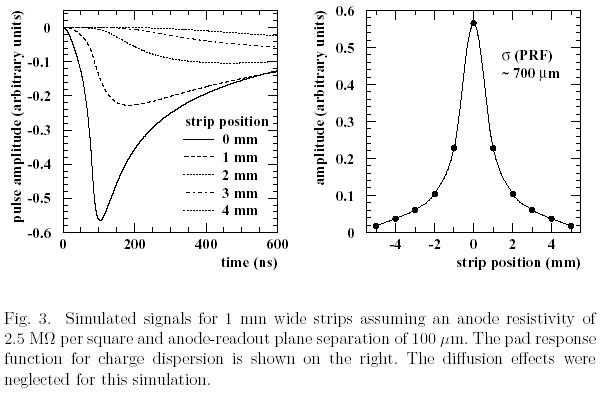
Model calculations were done for a GEM detector with a resistive anode readout
with 1mm wide strips. The anode resistivity and anode-readout gap in the simulation
were chosen to limit the charge dispersion over pads to about 700um, comparable
to transverse diffusion in a high magnetic field TPC. Simulated signals for
the readout strip directly below the initial charge cluster and for the 4 adjacent
strips are shown in fig. 3 as well as the simulated pad response function.
Back to Top
3.0 Experimental Setup
The charge dipersion tests were made with a modified double GEM detector filled with ArC02 (90/10). A 50um thick Mylar film with surface resistivity of 2.5 Mohm/sqaure was glued to the pad readout board. The spacing between the anode and readout planes was ~100um including the glue thickness.
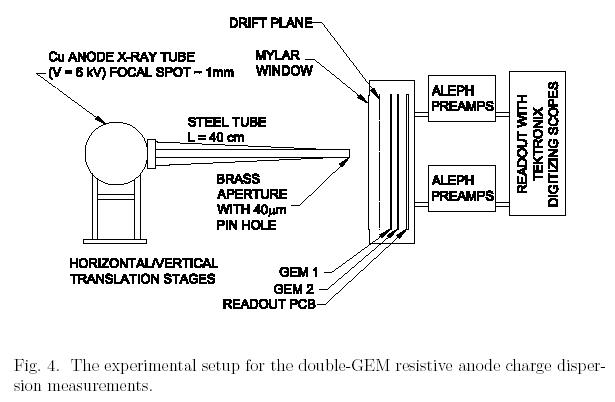
Fig. 4 shows the experimental setup for the space point resolution studies. The initial ionization is provdied by x-ray photon conversion in the gas. A ~40um pinhole in a thin brass sheet was used to produce a miniaturized focal spot image in the GEM drift gap. The size of the xray spot at the detector is estimated to be ~70 um. After avalanche multiplication and diffusion, the RMS size of the electron cloud reaching the resistiv anode was ~400um. The gas gain was about 3000.
 Signals
were read from 7cmx1.5mm strips. The frontend electronics consised of
Aleph TPC wire charge preamplifiers followed by receiver
amplifiers. Signals from 8 adjacent strips were digitized and recorded using
two 4-channel Tektronix oscilloscopes. The x-ray tube is mounted on a
motorized
stage that was used to move the x-ray in small steps over the width of a single
pad. At each x-ray position 1000 events are recorded. The observed shape
of a
pulse depends on the strip location with repect to the primary charge cluster
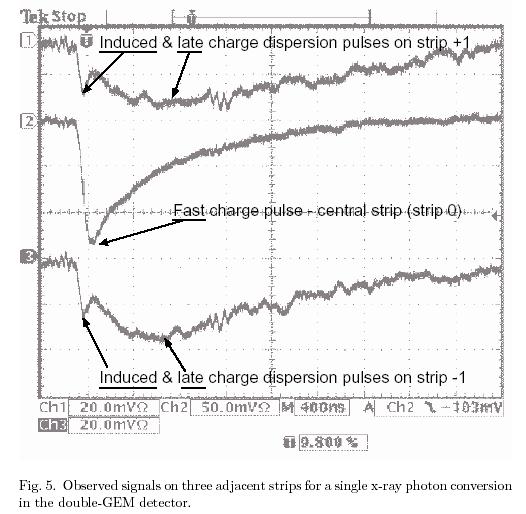
on the resistive anode. Fig 5 shows an event where x-ray spot is located
directly
above the centre of a readout strip. Pulses closer to the cluster have a faster
risetime and higher maximum amplitude than those that are further away.
An early
induced pulse is observed for all pulses. The pulses are produced by the motion
of the electrons in the GEM induction gap. Although they have demonstrated
position sensitivity, they require the se of high-speed pulse shape sampling
and
are specific to GEM detectors with large induction gaps. The induced pulse has
not been used in these studies.
Signals
were read from 7cmx1.5mm strips. The frontend electronics consised of
Aleph TPC wire charge preamplifiers followed by receiver
amplifiers. Signals from 8 adjacent strips were digitized and recorded using
two 4-channel Tektronix oscilloscopes. The x-ray tube is mounted on a
motorized
stage that was used to move the x-ray in small steps over the width of a single
pad. At each x-ray position 1000 events are recorded. The observed shape
of a
pulse depends on the strip location with repect to the primary charge cluster
on the resistive anode. Fig 5 shows an event where x-ray spot is located
directly
above the centre of a readout strip. Pulses closer to the cluster have a faster
risetime and higher maximum amplitude than those that are further away.
An early
induced pulse is observed for all pulses. The pulses are produced by the motion
of the electrons in the GEM induction gap. Although they have demonstrated
position sensitivity, they require the se of high-speed pulse shape sampling
and
are specific to GEM detectors with large induction gaps. The induced pulse has
not been used in these studies.
Back to
Top
4.0 Analysis
The collected data consisted of runs that scanned a single 1.5mm pad with 100um steps. Each data run consisted of 1000 unique events. The charge dispersion signal was confined to narrow region, with measurable signals only on three pads. The analysis to determine the space-point resolution from the event data consisted of the following steps:
- Determine the pulse heights of the signals on the strips, independant of risetime
- Compute a centre of gravity position for the event from the measured pulse heights
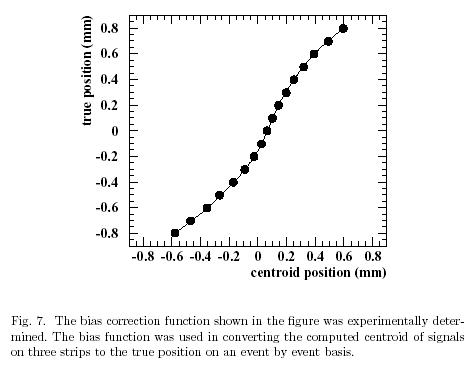
- Correct for the bias in the computed centre of gravity to obtain the position of the ionization cluster for the event. The standard deviation of the bias corrected centre of gravity position with respect to the known x-ray beam spot position for the run gaives a measure of the space point resolution
The centres of gravity for the events in the calibration data were
computed from the measured pulse heights. The correction function for
the bias in the centre of gravity method (fig. 7) was determined by
plotting the mean calculated result against the known x-ray position.
Having found the polynomial coefficients and bias correction function.
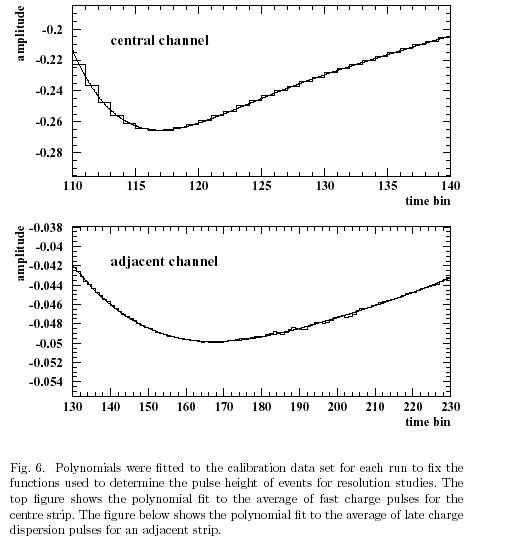
The individual events are used for resolution studies. As indicated
earlier, the pulse amplitudes are determined by fitting a fixed polynomial
shape to the data points. Having found the pulse amplitude for the
three channels of interest, the centroid calculation is made and is
converted to its true position using the bias correction function.
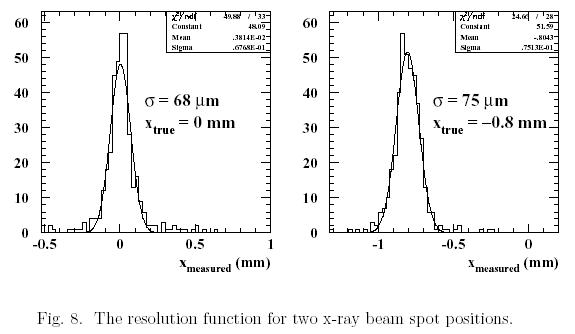
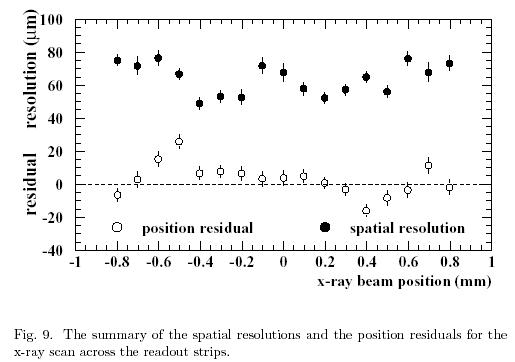
Fig 8 shows the results for the bias corrected centres of gravity calculations
at two x-ray positions. Fig 9 shows the spatial resolutions and position
residuals.
5.0 Conluding Remarks
The RC dipersion of the avalanche charge makes it possible to measure its position with a micro-detector with strips wider than preivously used. The pad response function and signal shapes are determined by the anode surface resistivity and anode readout plane gap. With proper choice of the RC time constant, the charge dispersion techniquie will not compromise the counting rate ability of the detector. Nor should it compromise the 2-track resolving power of the detector. The charge dispersion studies were done using a modified GEM detector. Experimental and Simulation studies are currently ongoing to tests the resolution capabilities of the charge dispersion technique with rectangular pads similar to those used in wire cathode pad TPCs. We are also testing the concept of position sensing from charge dispersion with Mircomegas where the high anode resistance may help improve the detector HV stability as well as protect th front-end electronics.
Back to Top